
Use Glade in VS Code
Task guide
Install the bundled extension, confirm project discovery, run one local Apex test, navigate a diagnostic, and start a debug session.
Glade uses the same parser, semantic checks, VM, storage, test runner, LSP, and DAP as the CLI. Glade actions stay local; Salesforce actions stay org-backed.
Before you start
- Install Glade and confirm
glade version. - Open a Salesforce DX project with
sfdx-project.json. - Run
glade doctor --project .successfully.
VS Code Extension
Install and verify the extension:
glade editor install vscode --force
glade editor doctor vscode
code --list-extensions --show-versions
Omit --editor for VS Code. Cursor and Windsurf use the same bundled VSIX:
glade editor install vscode --editor cursor --force
glade editor install vscode --editor windsurf --force
Expected: doctor checks the selected editor command and the bundled VSIX; it does not query the editor's installed-extension list. Confirm that code --list-extensions --show-versions includes glade.vscode-glade@ followed by its installed version. For Cursor or Windsurf, use that editor's CLI.
The extension is distributed in the release archive at share/glade/editor/vscode-glade.vsix, not through a promised Marketplace or Open VSX listing. Installing the VSIX does not require a particular theme or a clean profile. Reload the editor after installation.
1. Confirm the workspace
Open the Glade Activity Bar and run the Glade: Open Home command. Start Here should show the Salesforce DX project root, active local data environment, test state, and recent command status.
If the wrong root appears, open the folder that contains sfdx-project.json and rerun glade doctor --project . in the integrated terminal.
2. Run one local test
Local Apex tests appear under Glade Apex in the native VS Code Testing view. Use Test Explorer or a Local CodeLens action. Focused runs call:
glade test --project PROJECT_ROOT --json --class CLASS_NAME --method METHOD_NAME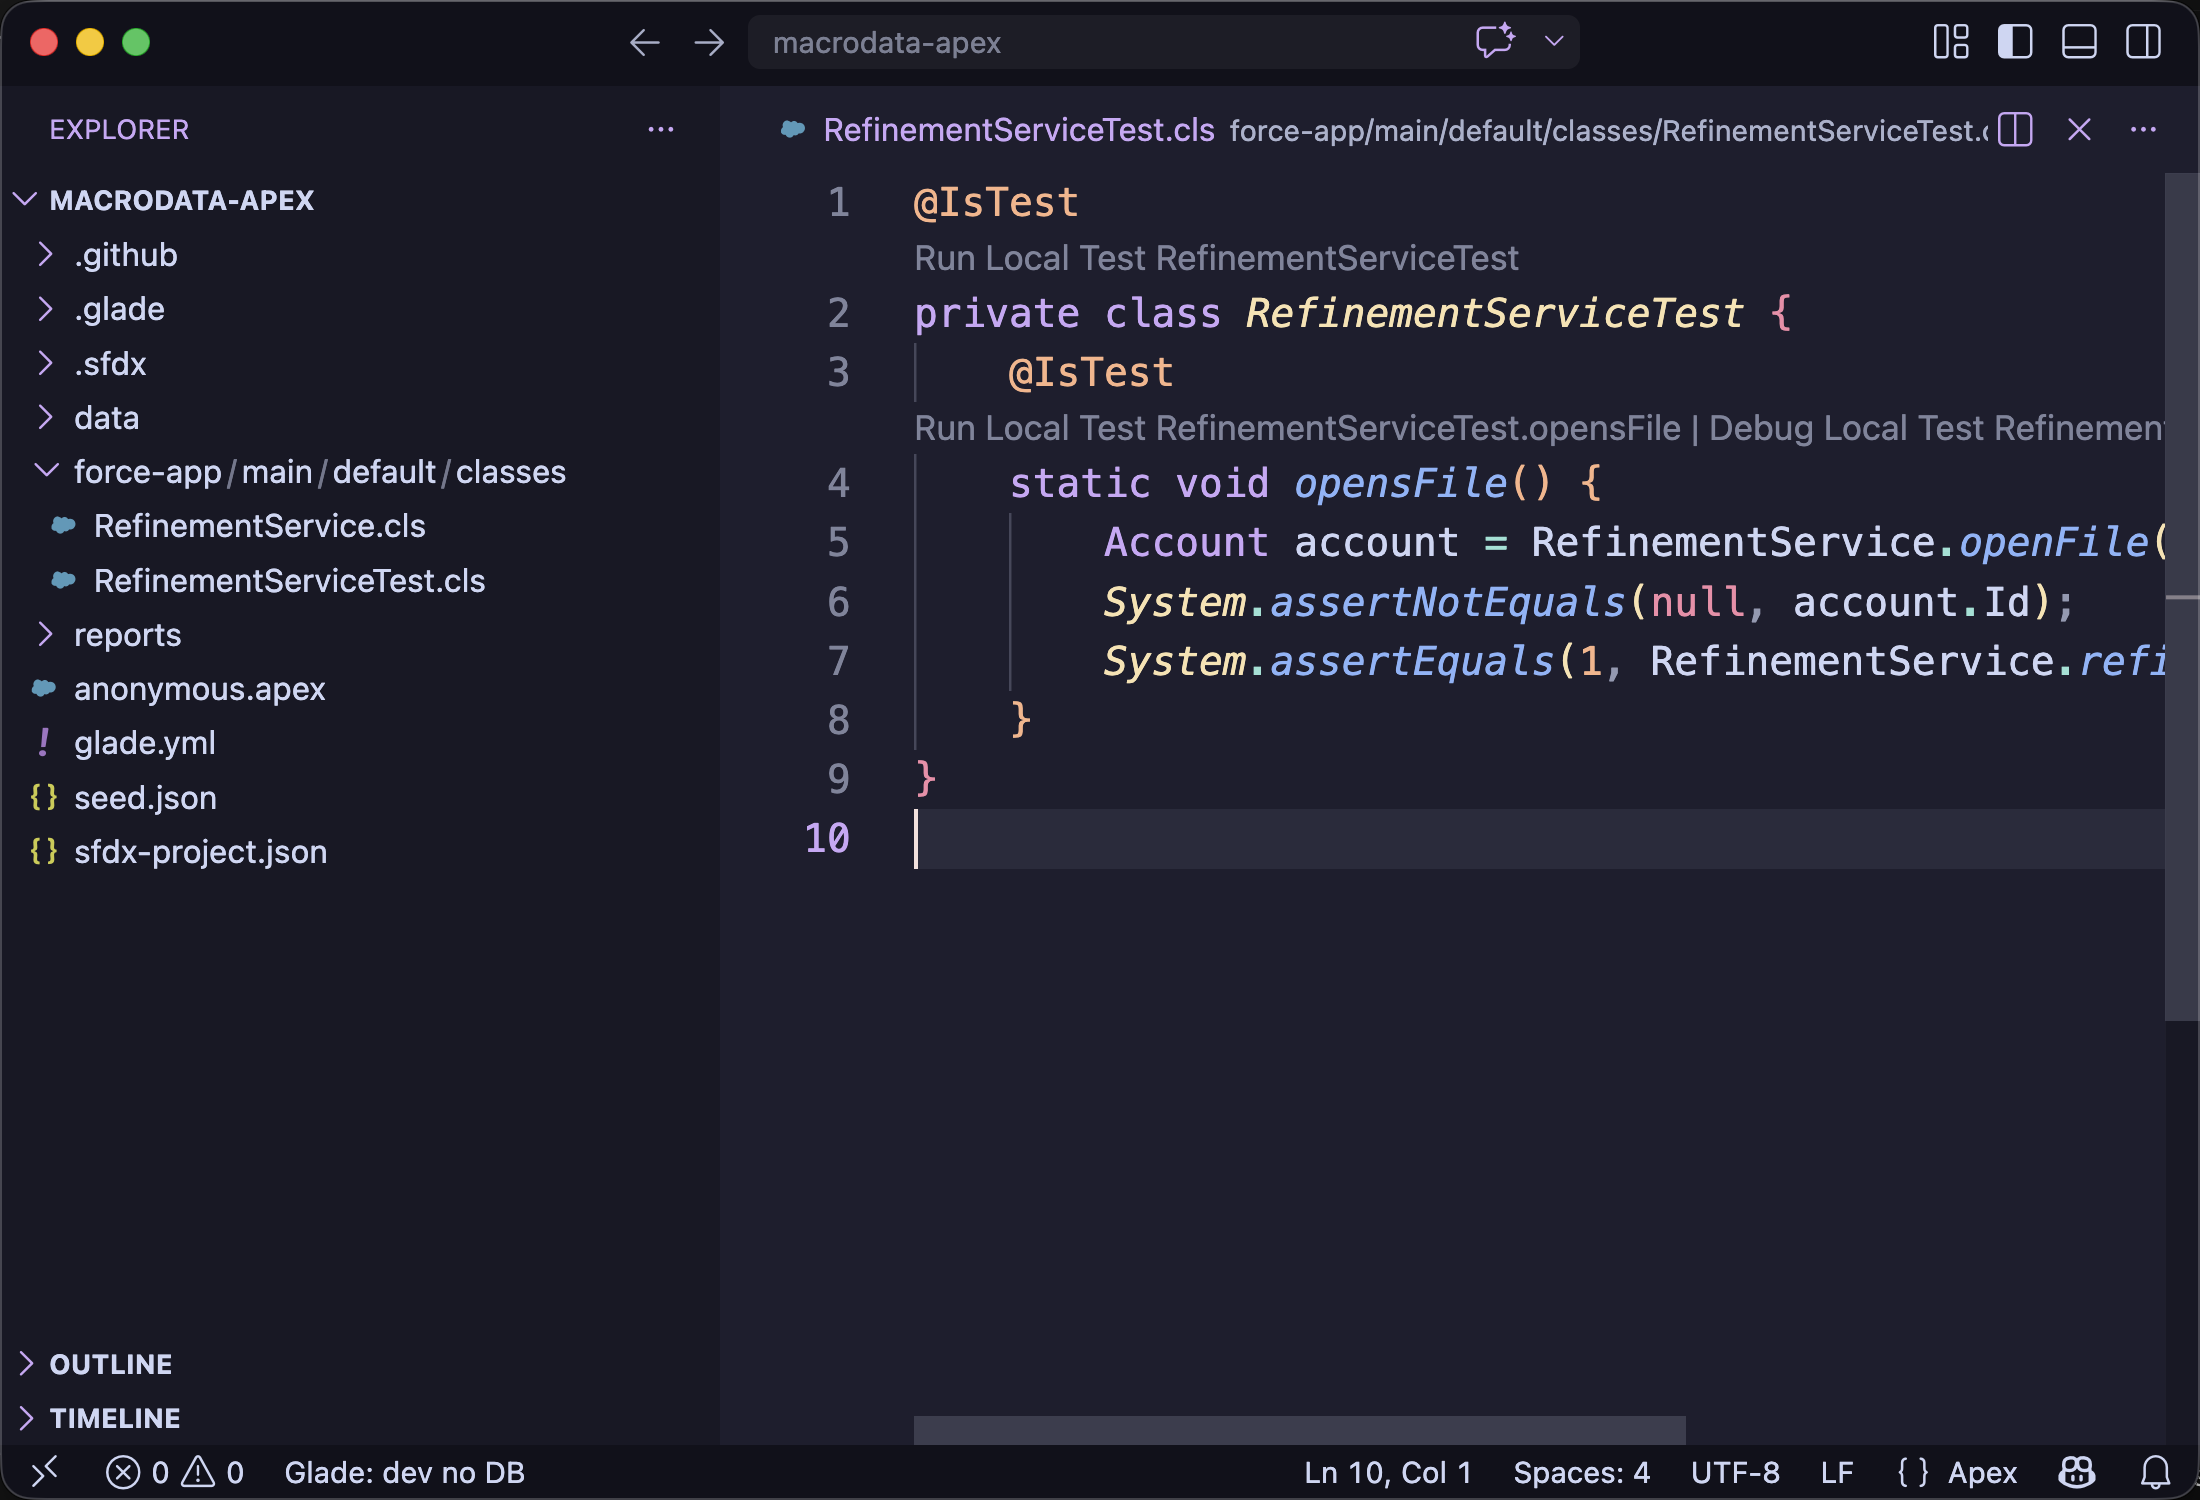
Expected: the test node shows pass or fail status and Glade Output includes the selected class, method, and local result. Changed and warm-watch runs use:
glade test changed --project PROJECT_ROOT --since origin/main --json
glade test --project PROJECT_ROOT --daemon --watch
3. Navigate a diagnostic
Click Run local proof in Glade Home or run Glade: Check Project. Select a Glade entry in Problems to open its file and source location. Glade does not replace Salesforce extensions, org-backed CodeLens, or language-server ownership.
4. Start a debug session
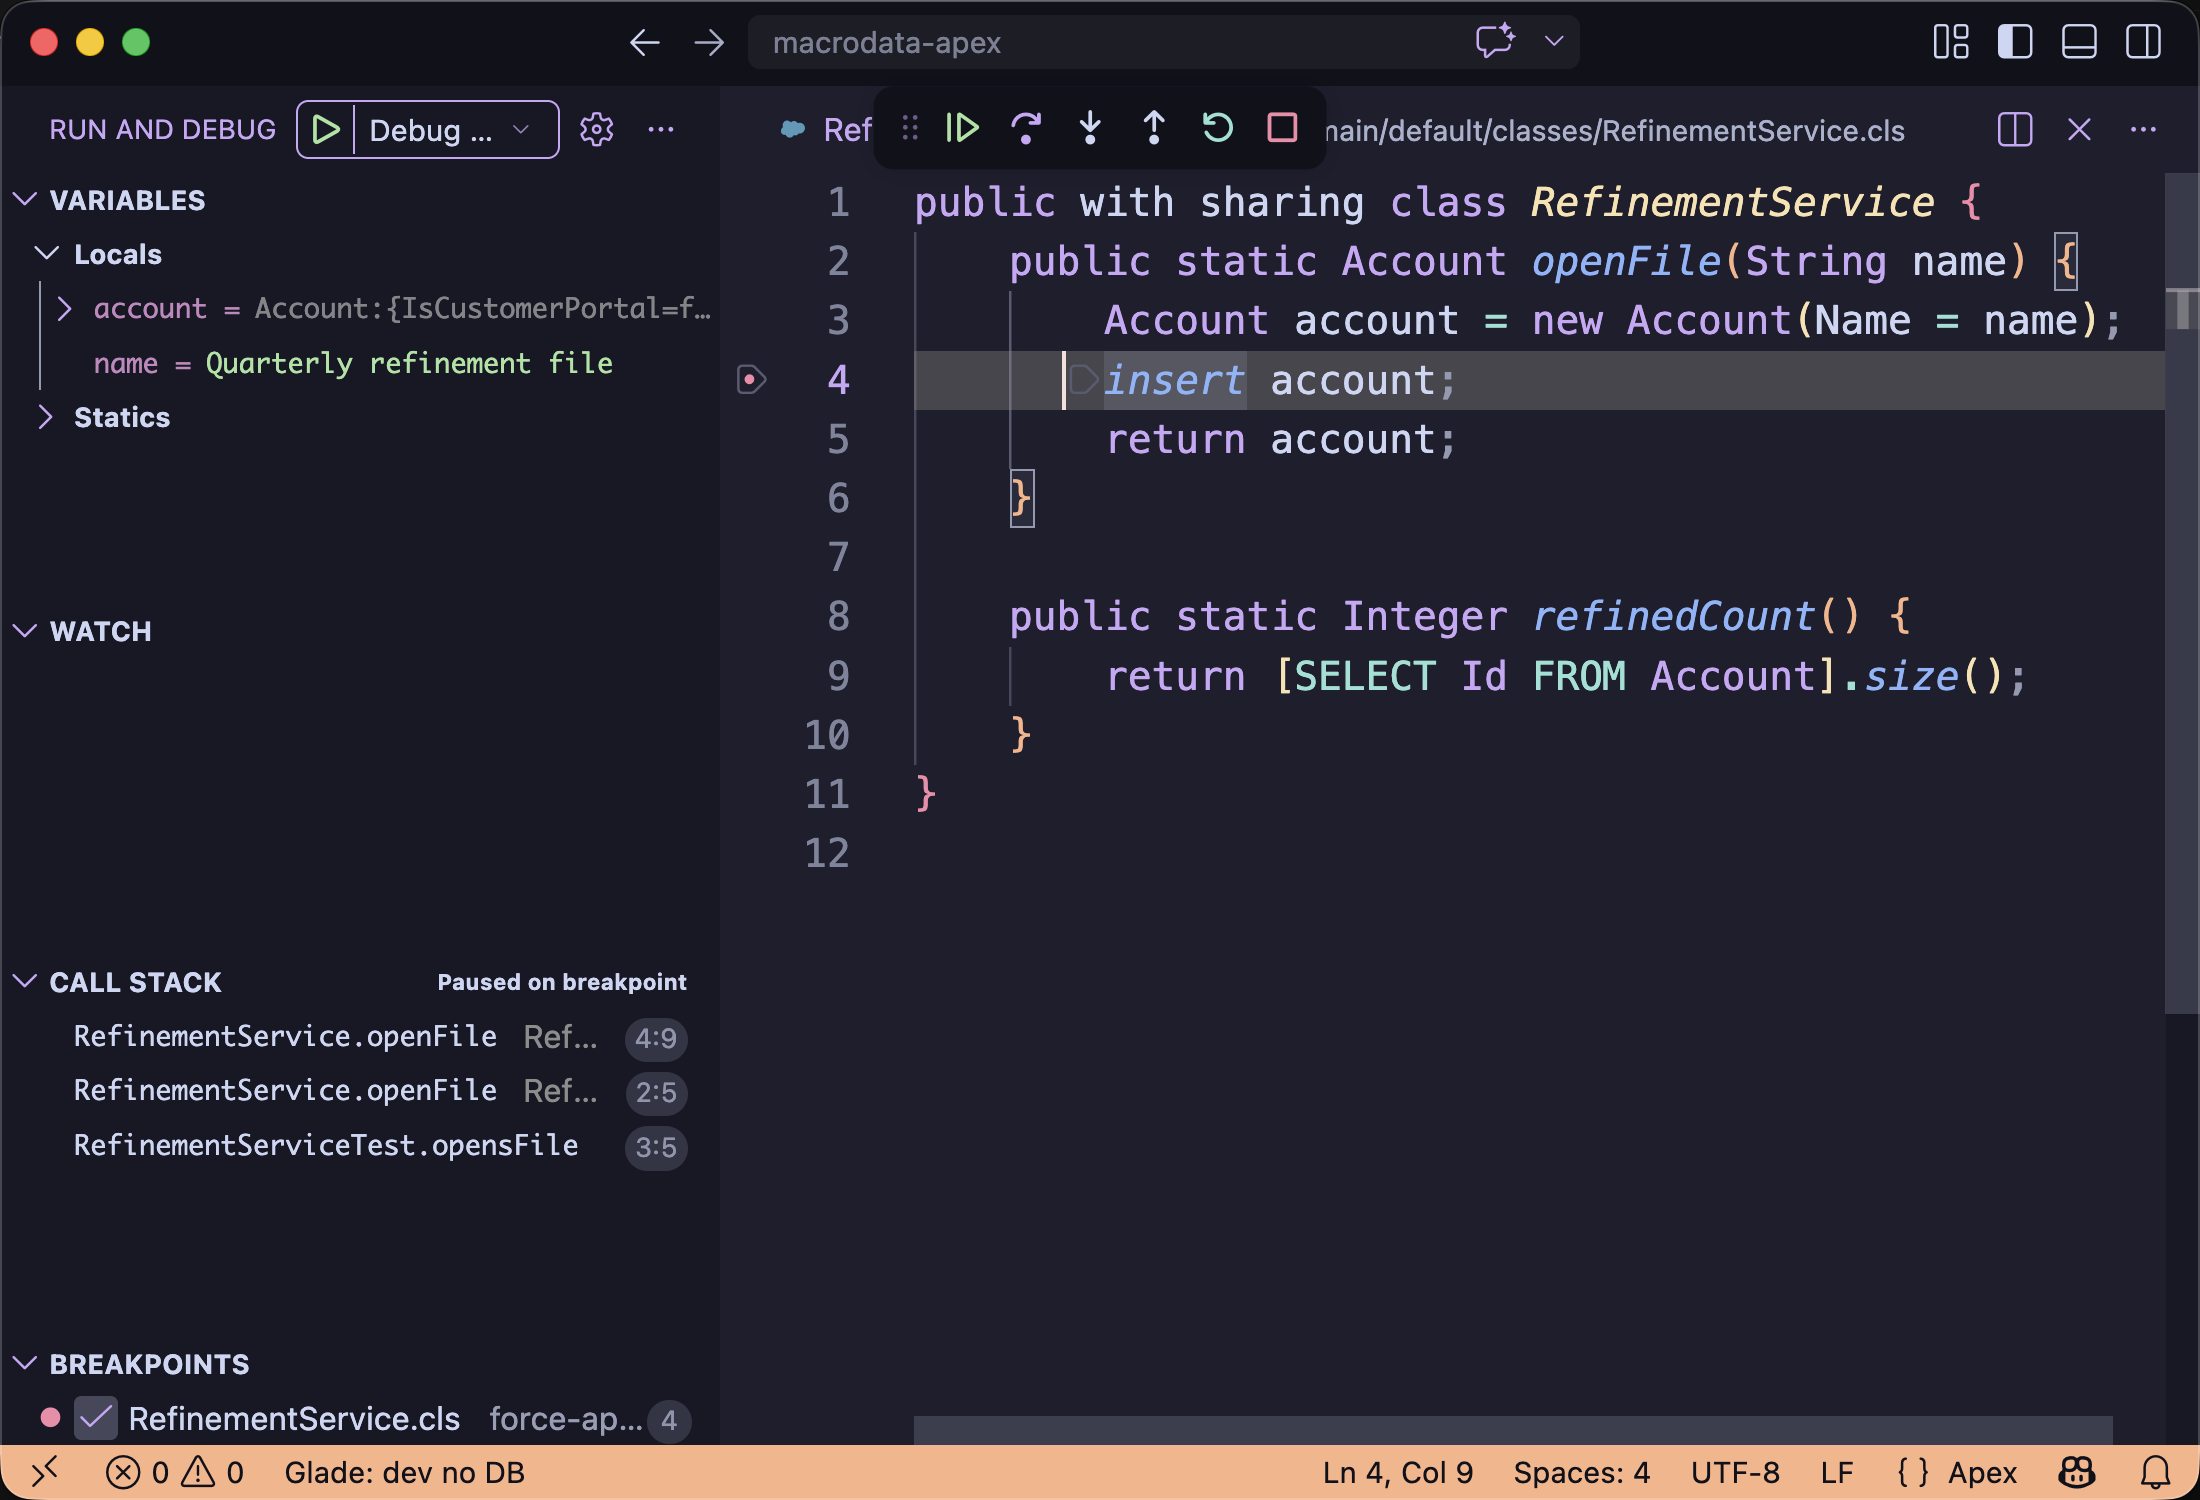
Set a breakpoint in the normal editor gutter, then choose a local debug action from Test Explorer, CodeLens, or Apex & SOQL. Anonymous and test debugging use the active local data environment:
glade dap --project PROJECT_ROOT --db ACTIVE_DBExpected: VS Code Run and Debug stops at a supported breakpoint and exposes stack, variables, and debug-console state. See Debug Apex for the task path and DAP reference for protocol details.
Native VS Code surfaces
The extension uses one Glade Activity Bar item and native VS Code surfaces:
- Start Here / Glade Home for run, data, debug, Salesforce, and ship actions.
- Tests and native Test Explorer for focused, changed, failed, and watch runs.
- Data Environments and Data Browser for named SQLite-backed state.
- Apex & SOQL for supported local snippets and queries.
- Problems, the normal editor gutter, and Run and Debug for diagnostics and breakpoints.
The Status Bar summarizes the active data environment and last local command. Click it to switch data, run local proof, manage plugins, or open output.
Local data
The default environment is dev at .glade/envs/dev.sqlite. Add named environments in workspace settings:
{
  "glade.environments": [
    { "name": "dev", "dbPath": ".glade/envs/dev.sqlite" },
    { "name": "feature", "dbPath": ".glade/envs/feature.sqlite" }
  ],
  "glade.activeEnvironment": "feature"
}
Anonymous Apex persists successful DML to the active environment:
glade exec --project PROJECT_ROOT --db ACTIVE_DB --log-out reports/exec.log "insert new Account(Name='local');"Plugin actions and findings
The extension reads installed and linked plugins through:
glade plugins list --jsonInstalled plugins may add actions to Start Here, Tests, Data Browser, Debug, or Plugins. glade.findings.v1 output appears in VS Code Problems with severity, message, source location, rule id, and source.
Common setup failures
- No project: open the folder containing
sfdx-project.json, then runglade doctor --project .. - Extension missing or stale: run
glade editor install vscode --force, then reload the window. - No tests: confirm Apex test classes are inside a configured package directory.
- No breakpoint hit: use a supported local test or anonymous Apex path and check the active data environment.
- No local diagnostics: set
glade.enableLsp=trueonly when you want the optional Glade language server.
Use Troubleshooting for symptom-first recovery.
Reference and development
- LSP reference covers invocation, capabilities, configuration, and logs.
- DAP reference covers launch behavior, breakpoints, and limits.
- Develop and package the extension is contributor-only.
- Preview LWC and Preview Visualforce remain separate browser workflows.