
Profile an Apex Debug Log
Task guide
Turn a Salesforce Apex debug log into a local profile report.
- Run `glade debug profile` on a saved log.
- Read limits, categories, and Hot events.
- Save JSON for automation or follow-up review.
Before you start
- You have a Salesforce debug log saved on disk.
- Run from the Salesforce DX project root when you want project context nearby.
- You have a terminal open at the project root.
- The log does not contain secrets you should not store in local reports.
Steps
1. Profile the log
bash
glade debug profile --log <debug-log> --format markdownExpected: Glade prints a runtime summary, limit counts, categories, and Hot events.
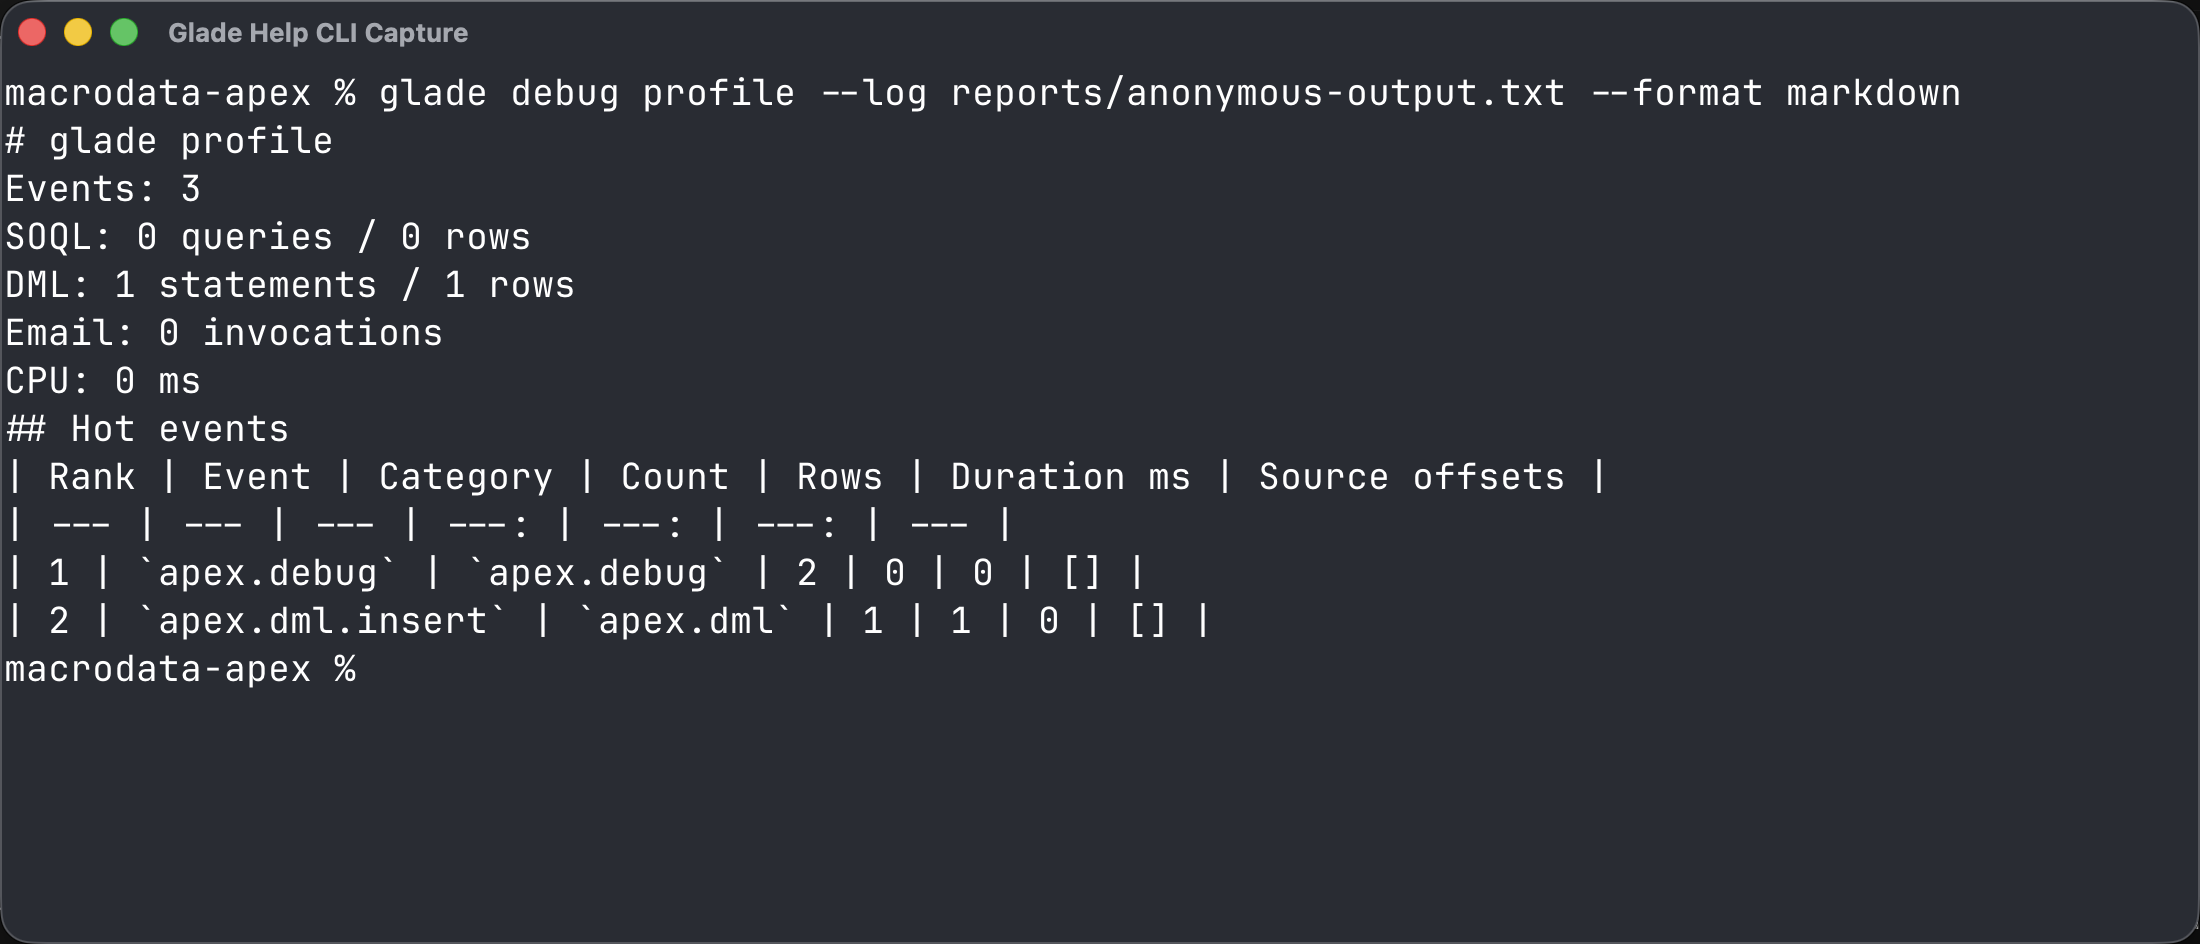
2. Save JSON for automation
bash
mkdir -p reports
glade debug profile --log <debug-log> --json > reports/apex-debug-profile.json
Expected: the JSON report records the profile status, summary limits, and hot event rows.
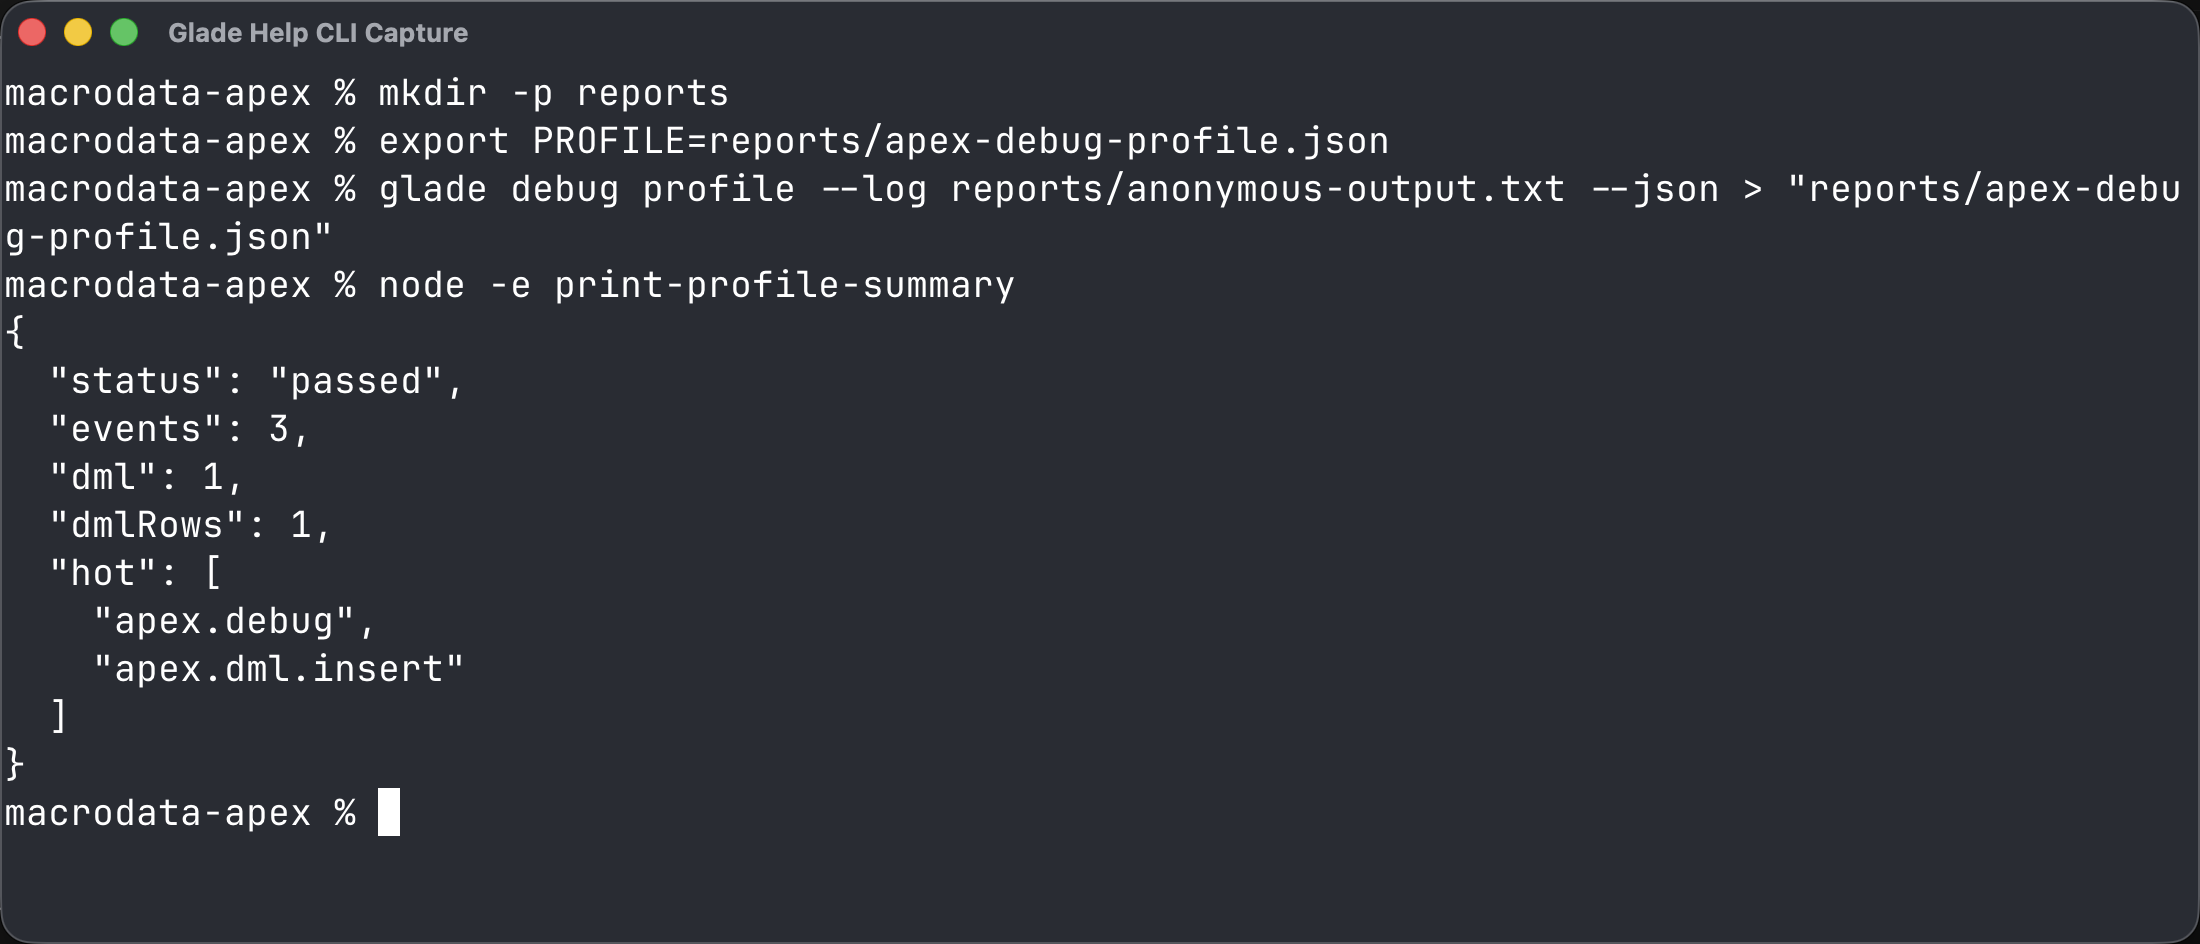
Common wrong turn
glade profile analyze reads Glade native trace JSON from glade test --trace. Use glade debug profile for Salesforce Apex debug logs.