
Debug Apex in VS Code With Breakpoints
Task guide
Set a normal Apex gutter breakpoint and debug a local test through Glade DAP.
- Set a breakpoint in a path the selected test executes.
- Start `Debug Local Test`.
- Open Run and Debug while the session is active.
Before you start
- The bundled Glade VS Code extension is installed. Keep your existing theme and profile.
- A local data environment is selected.
Steps
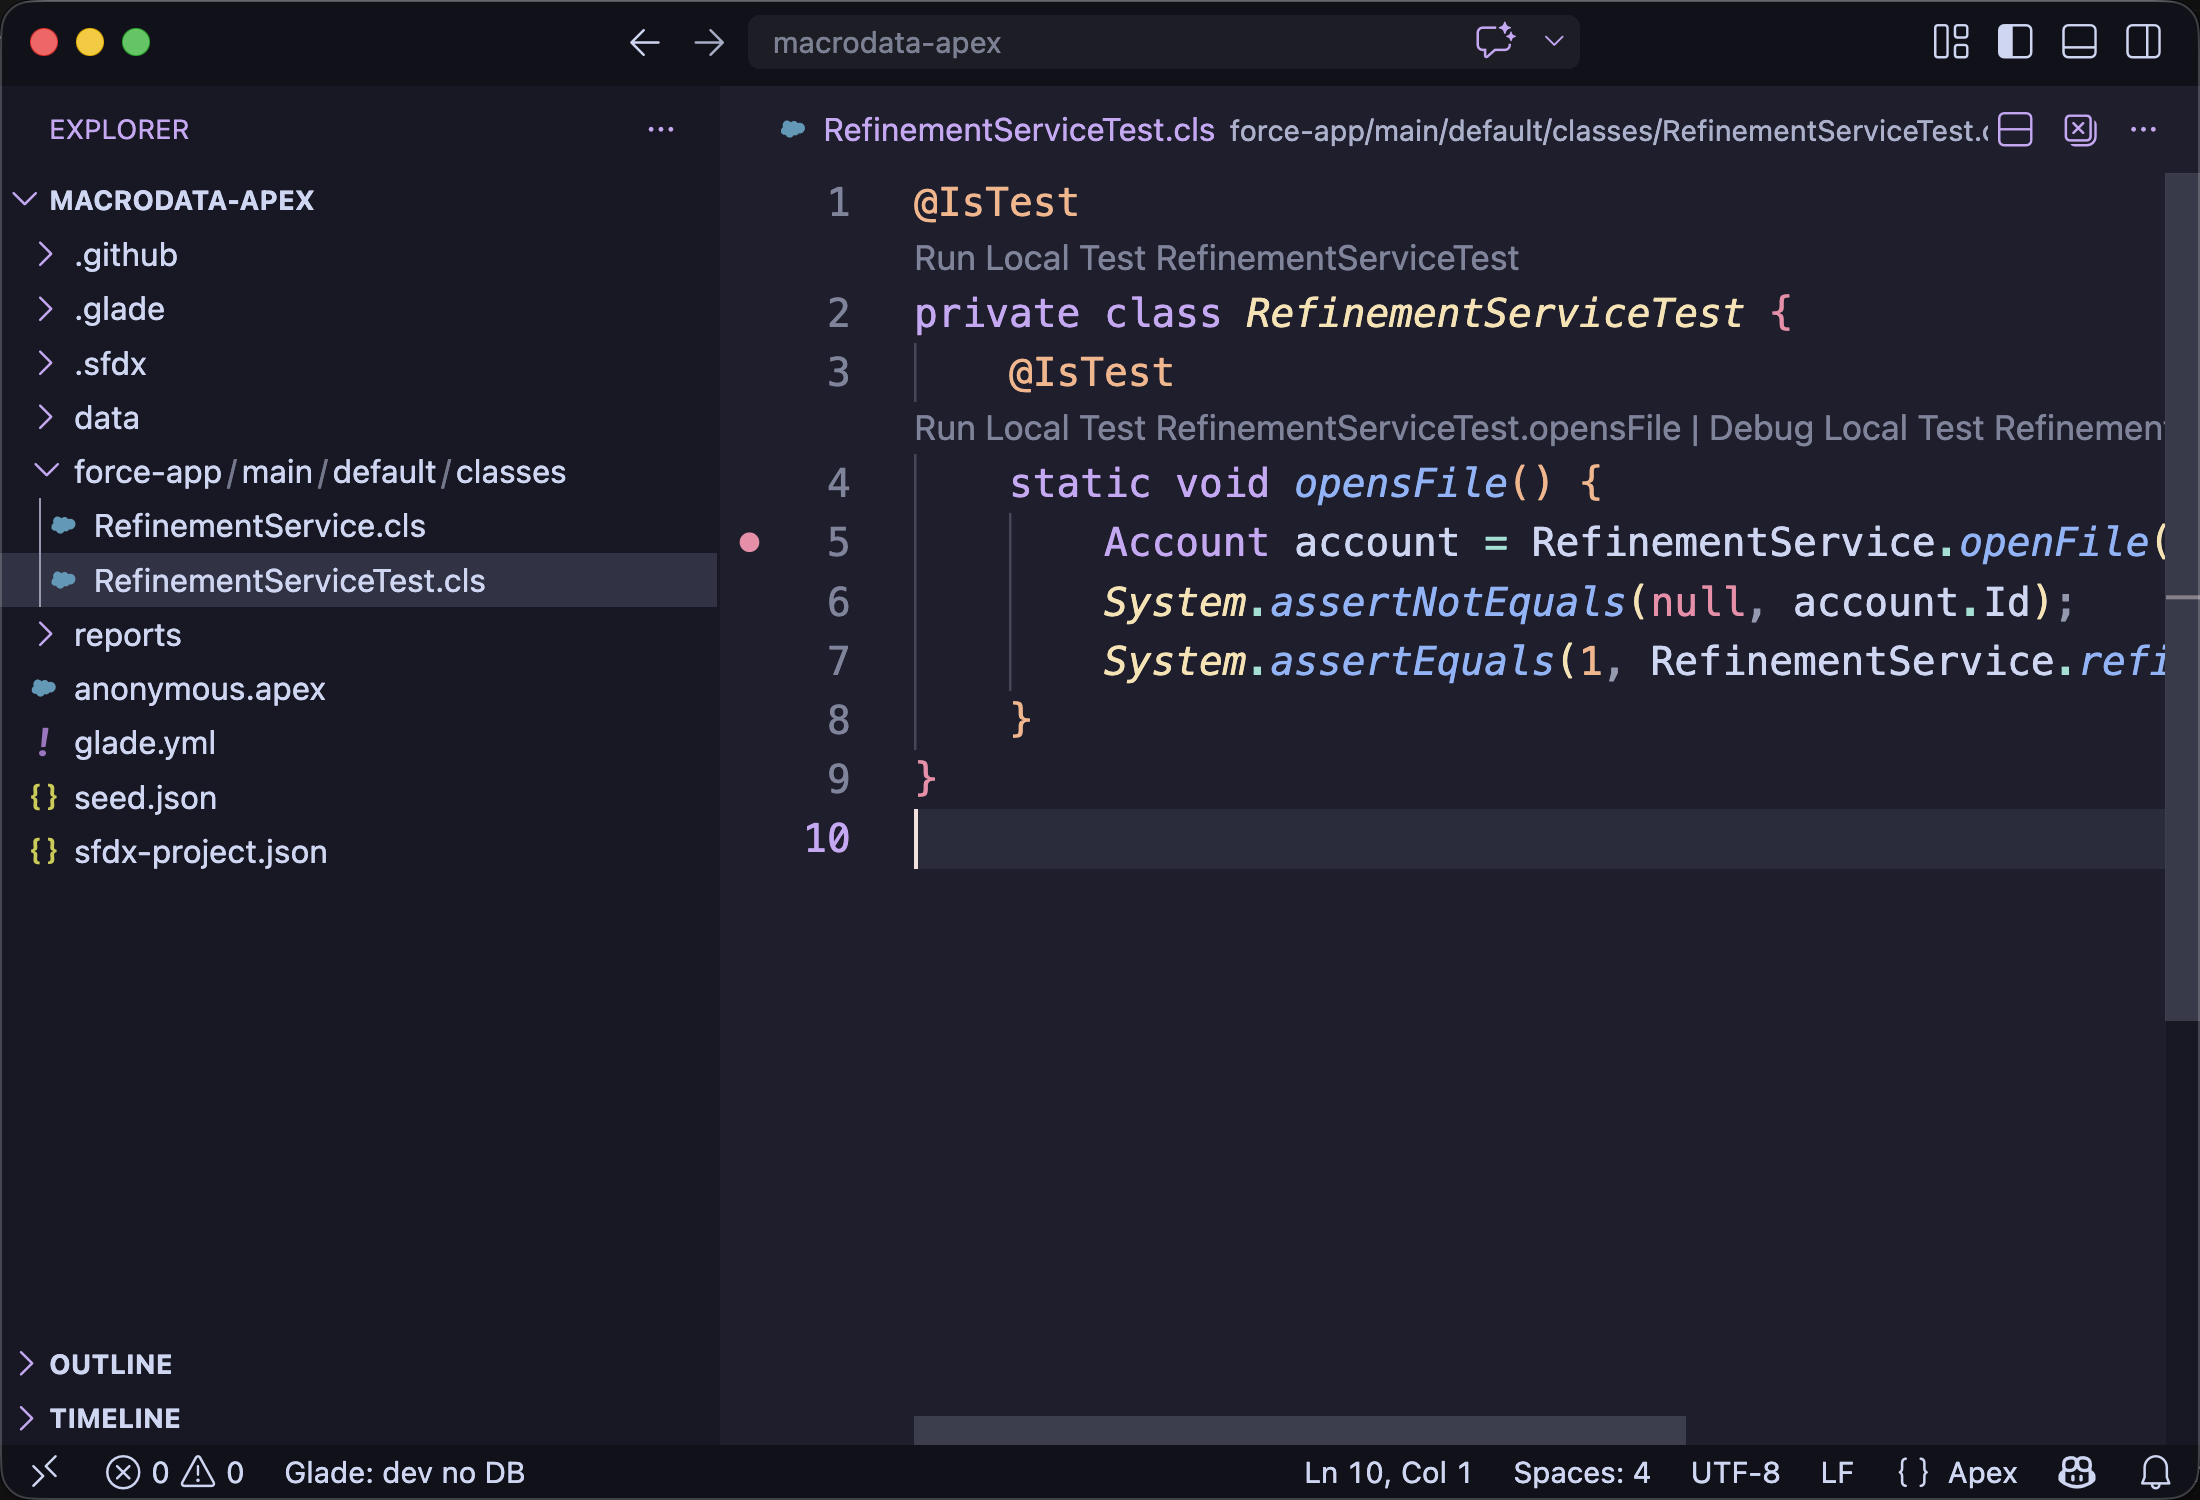
1. Set a breakpoint
Open an Apex class or test file. Click the editor gutter beside the line you want to stop on.
2. Start the local debug session
Click Debug Local Test from CodeLens or use the Glade Debug view action.
Expected: VS Code opens a normal debug toolbar and Glade starts a DAP session.
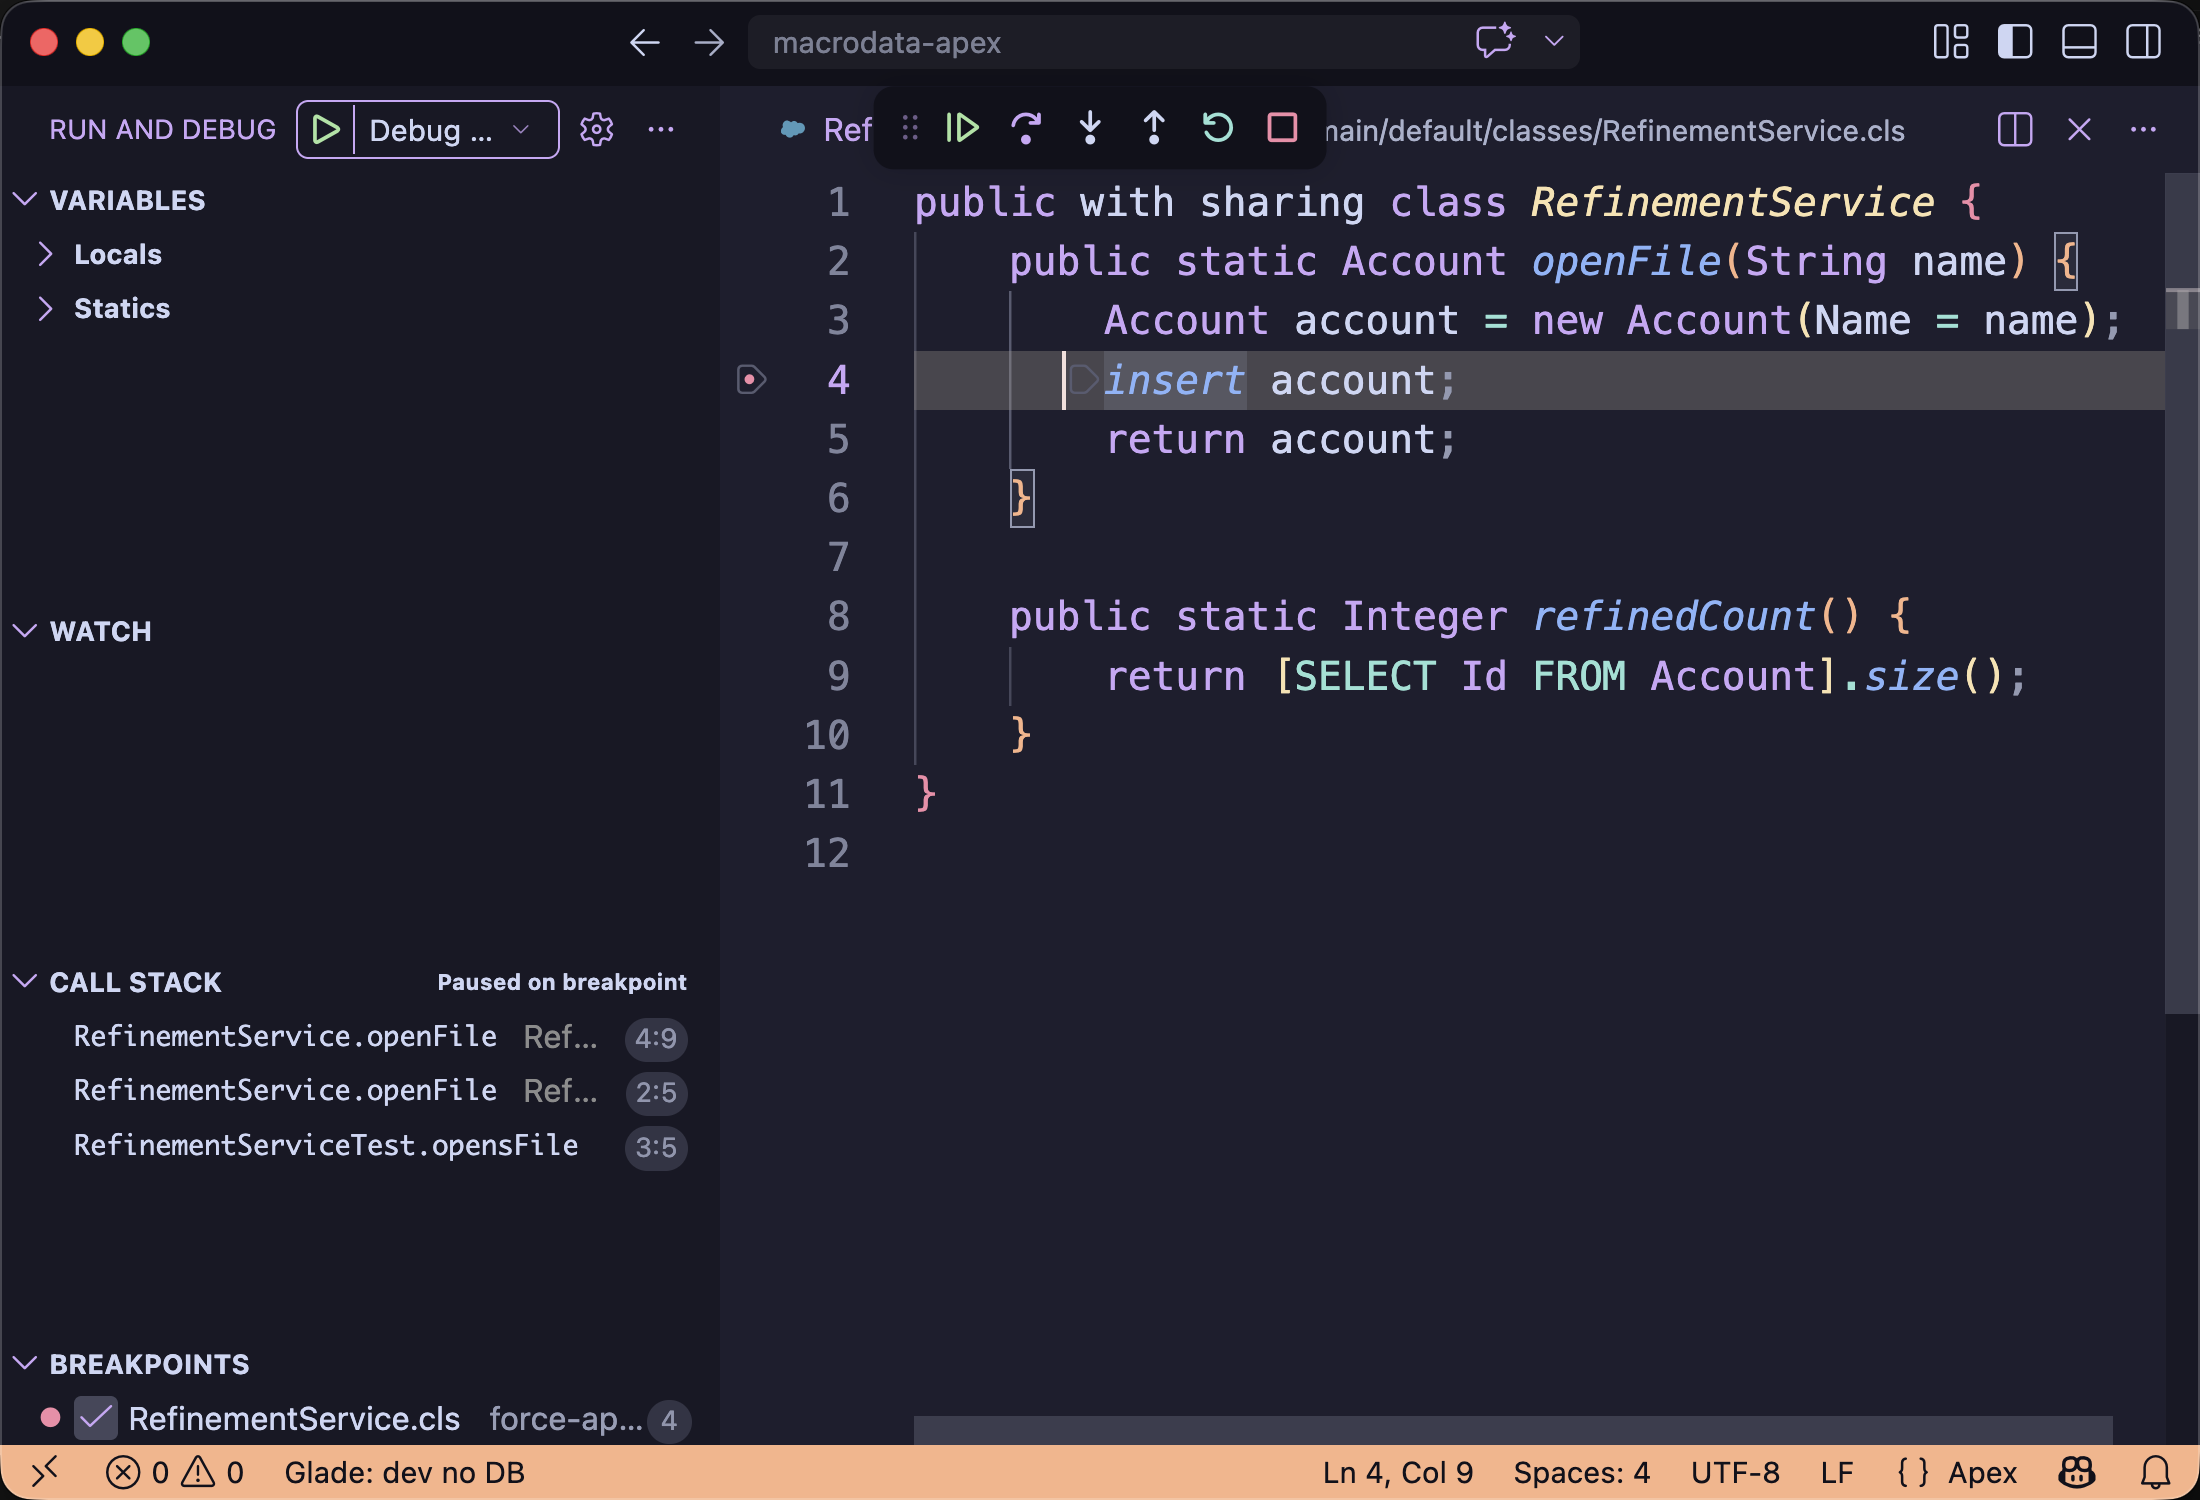
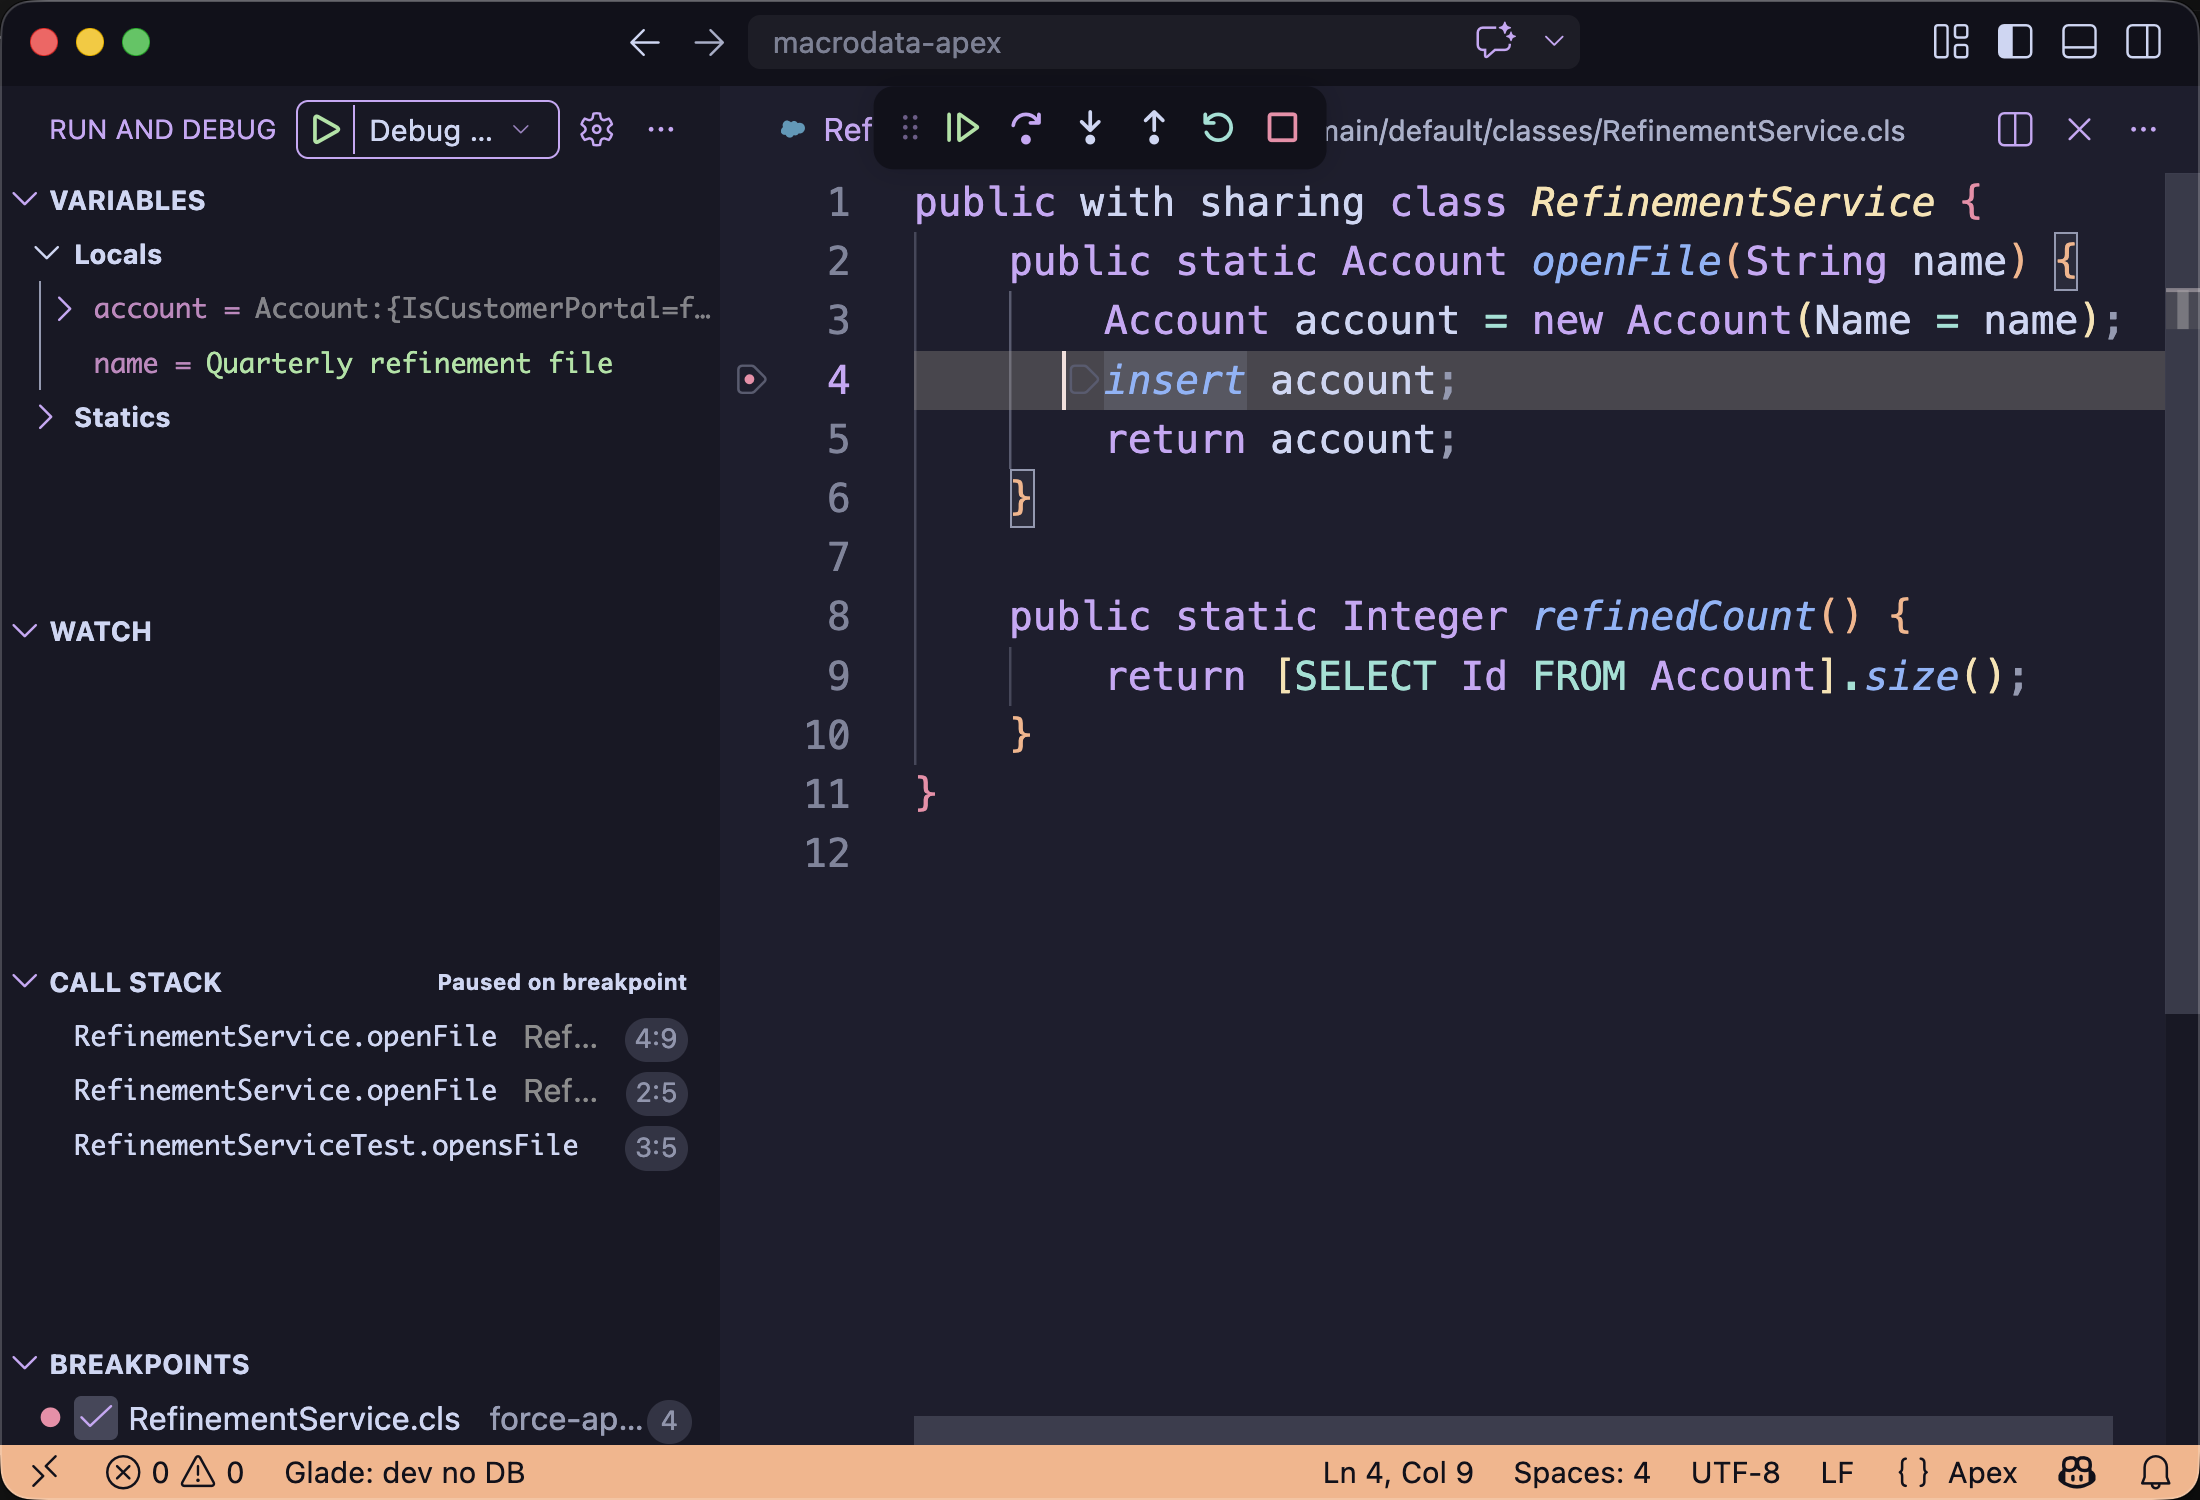
3. Inspect the debug panes and output
Use Step Over, Variables, Watch, and Call Stack first. Open Debug Console or the Glade output channel only when you need logs.
Common wrong turn
If debugging starts but does not stop, check that the breakpoint is in a supported .cls or .trigger file and that the test path executes that line.